- +1 919 200-0292
- info@antennatestlab.com

Advanced Graphics
Advanced Graphics
The best way to visualize swept frequency antenna pattern results.
We supply all customers with these interactive graphs for easy viewing of their 3D spherical or 2D polar antenna test results. This single HTML file is simply opened in your browser to allow you to zoom, rotate, and pan your plots at any frequency. You can even download plots as graphic files. Simple! No special viewer software for anyone to install.
Video Presentation Files
We can also render MP4 video files with swept frequency. We stitch together hundreds of different 3D gain plots at all of your test frequencies into a standard video file. You or your customers can visualize 3D patterns in broadband antennas simply by watching the video on your website or social media. You can easily pause and scrub back and forth to see your patterns at any test frequency.
Special Projects
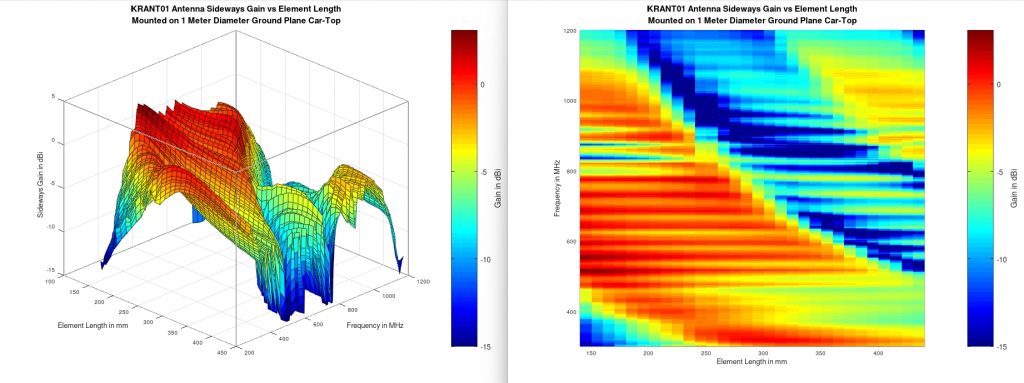
With decades of antenna testing experience, we can create custom test programs and plots that other labs won’t touch. Take for instance this Kraken direction finding antenna. It has a variable length telescoping element that greatly influences VSWR and sideways gain over it’s operating range. Here it is evaluated at 31 different lengths while swept over frequency. The “heat map” of gain vs frequency vs length helps the user pick just the right element length for the job.