- +1 919 200-0292
- info@antennatestlab.com

Pattern Angular Resolution
Pattern Angular Resolution
Detail Levels And Pattern Resolution
Electromagnetic simulator outputs routinely display antenna radiation patterns with a precise 1- or 2-degree angular resolution. While easily generated in software like HFSS or CST, attempting to physically measure a 1-degree resolution in an anechoic chamber requires the positioner to move/point to over 65,000 directions. This sheer volume of mechanical movement and data acquisition makes ultra-high angular resolution measurements impractical.
To balance measurement fidelity with practical test times, we typically rely on 10-degree and 5-degree spherical grids for capturing an antenna’s gain pattern. A 10-degree resolution provides a robust baseline for standard 3D plotting, capturing necessary main lobes and side lobes without excessive chamber time costs. Determining the correct resolution is a direct trade-off between the complexity of the antenna’s radiation pattern and the budget allocated for testing.
Characterizing an antenna requires selecting the 3D spherical grid resolution to the specific gain and frequency characteristics of your antenna. The following resolution tiers illustrate the progression of data fidelity when mapping a physical antenna’s gain pattern:
 |
30 Degree Resolution (91 point spherical grid), crude 3D visualization |
 |
20 Degree Resolution (190 point spherical grid), coarse grid size for 3D visualization |
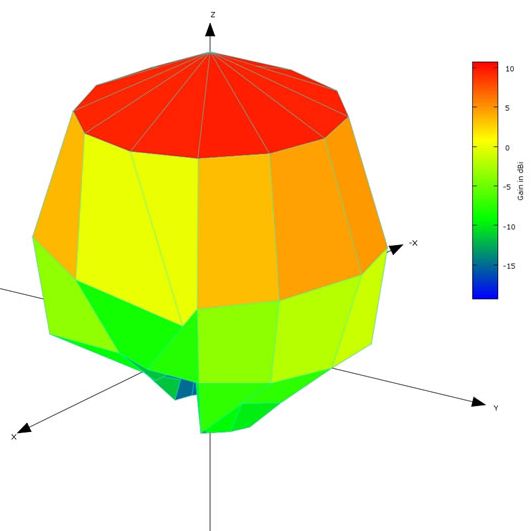
 |
10 Degree Resolution (703 point spherical grid), still practical test times while very good for 3D visualization |
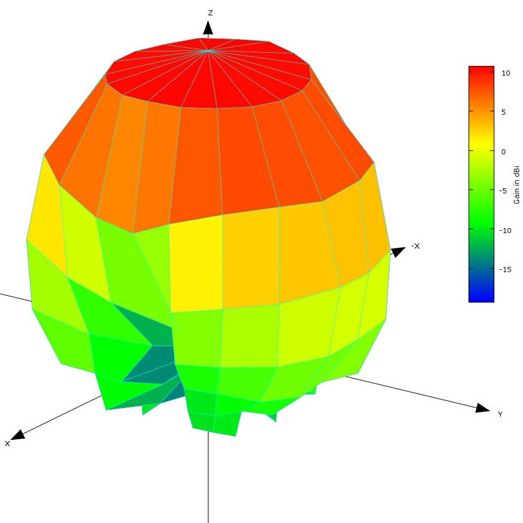
 |
5 Degree Resolution (2701 point spherical grid), longer test time, for very detailed plots; Great for complex or high-directivity patterns; These plots are also preferred for publication or antenna marketing; At frequencies above 10 GHz, directional antennas (especially horns with gain >15 dBi) should be tested with 5 degrees of angular resolution |
(The 3D plots above are all click to enlarge.)
Your Antenna
Want to find out what your antenna pattern looks like? Partner with Antenna Test Lab Co and get results! Contact us here.